

Here are a few examples of the inequities that still exist today.
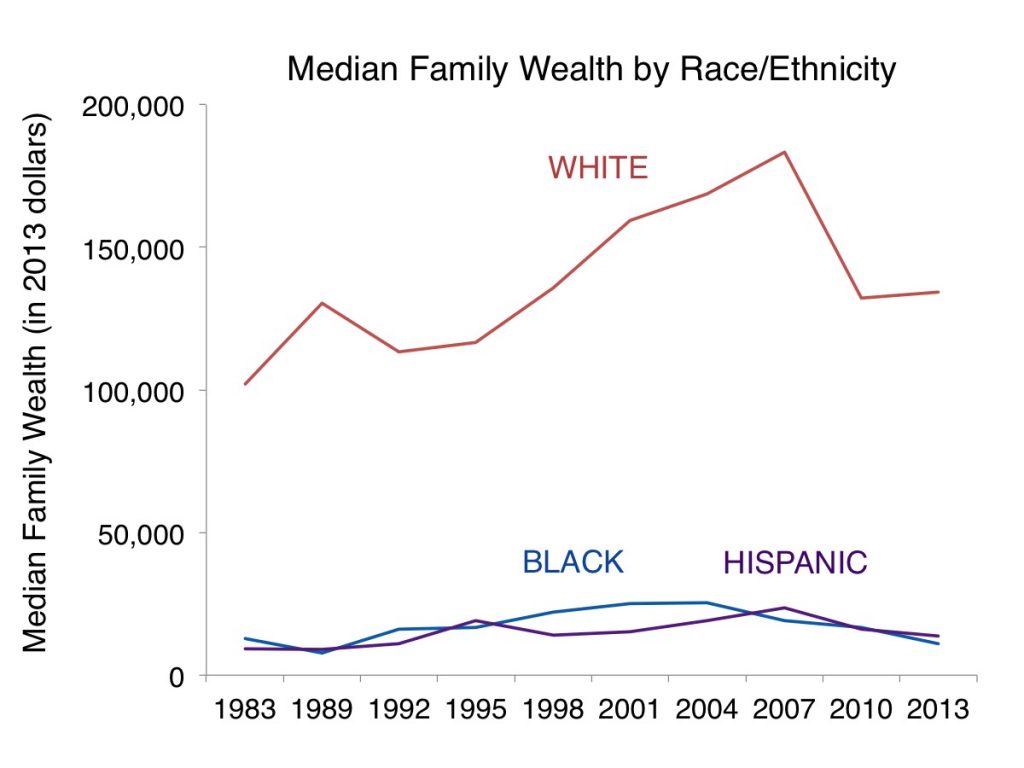
First let’s look at the average wealth of families of different races. This graph plots the median wealth of Black, Hispanic and White families over a 30-year period, between 1983 and 2013. If you were to list the wealth of each family from lowest to highest, the median wealth would be the wealth of the family who falls in the exact middle of the list. The median wealth of a family, which includes things like homes, investments and savings are on the vertical axis. The years between 1983 and 2013 are on the horizontal axis. The blue line represents the median wealth of Black families. The purple line is the median wealth of Hispanic families. The red line is the median wealth of White families. In 2013, on average White families had $120,000 more in wealth than Black or Hispanic families. $120,000! For many families that is the difference between whether or not you can own your own home.
-
- Bias
- the belief that some people or ideas are better than others, usually resulting in unfair treatment
- Biological race
- physical racial features such as skin color, hair textures, and facial features
- Explicit racism/bias
- racism that is plainly expressed through words and or actions
- Implicit racism/bias
- racism that hides in our unconscious biases and gets expressed in our actions
- Racism
- the beliefs and practices that uphold and reinforce inequalities based on race
- Social identity
- a person’s sense of self that is based on group membership
- Social race
- The social norms, attitudes, beliefs and behaviors that accompany racial groups
- Systemic racism
- policies, practices, and laws that reinforce social inequalities by discriminating against groups of people, either directly or indirectly, and limiting their rights